Picture Trade Beautifully
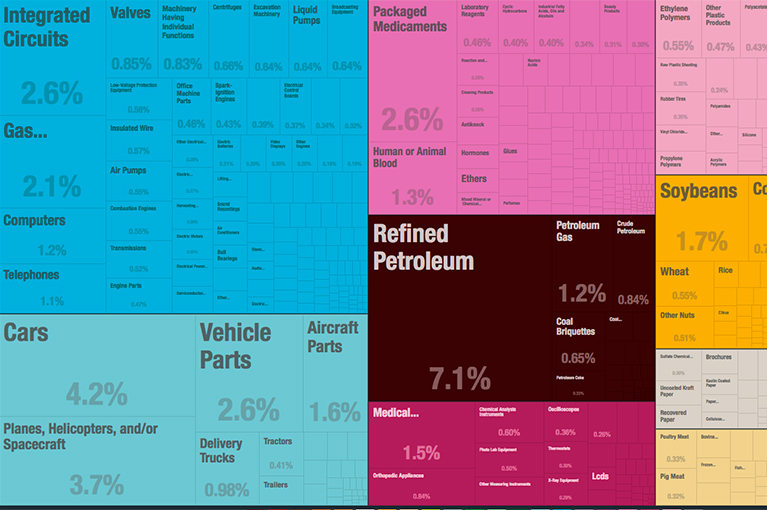
The Observatory of Economic Complexity offers a tool that is as beautiful as it is educational (not mention fun to use), enabling users to “quickly compose a visual narrative about countries and the products they exchange.”

The Observatory of Economic Complexity offers a tool that is as beautiful as it is educational (not mention fun to use), enabling users to “quickly compose a visual narrative about countries and the products they exchange.”
The World Bank offers an easy way to visualize trade flows between countries and regions searching by geography or product using its database, the World Integrated Trade Solution.

The World Trade Institute at the University of Bern created a database called DESTA that houses data on approximately 790 preferential trade agreements signed between 1947 and 2014.
TPP is significant because it constitutes the largest regional trade agreement ever implemented outside of the WTO. TPP was negotiated among 12 countries on both sides of the Pacific. Those countries together generate roughly 40% of global economic output (GDP).
The new World Trade Outlook Indicator tool measures how fast or slow world trade is moving compared with projections for medium-term trends.
Metropolitan cities form the backbone of supply chain and co-production platforms of North American advanced manufacturing. Explore this data set to see which pairs of cities trade the most and which manufacturing industries are the most integrated in North America.